VRChat Retention, Part 1: Turning a Product Question Into a Defensible Statistical One
VRChat Retention — a Bayesian survival analysis of 267,903 VRChat reviewers on Steam (not all players — see Part 1), built entirely from public data. Headline: churn risk collapses in the first 90 days and then goes flat for three years, and the five engagement segments are on genuinely different clocks.
Part 1 — the estimand · Part 2 — three regimes · Part 3 — when simple models fail · Part 4 — five lifecycles · Part 5 — from model to decision
The short version
For a social platform, the useful retention question is not how many people are online today. It is how long do people stay, when are they most likely to leave, and are all users on the same clock?
I built a Bayesian survival model of 267,903 VRChat reviewers from public Steam data to answer that.
What it found. Churn risk falls by a factor of 212 over the first 90 days and then goes flat for three years — so the first 90 days is where a timed intervention has something to aim at, while the larger absolute loss that follows has no window in it and needs an always-on mechanism instead. A third of everything the weakest segment will ever lose, it loses in those first 90 days. And value tracks headcount far more closely than the usual whale story assumes: the heaviest 12.1% of reviewers account for 19.6% of all expected retained time — 1.63× over-represented, against a structural ceiling of 1.91×.
This first part is about none of that. It is about the work that happens before any model: deciding what quantity is actually estimable from the data in hand, and refusing to estimate the one that isn’t.
That sounds like throat-clearing. It isn’t. Three decisions made here — where the clock starts, what counts as churn, and what to do with the 8.5% of people whose data is structurally strange — determine every number in Parts 2 through 5. Get them wrong and the rest of the work is precise and useless.
1. The question, and why a dashboard cannot answer it
Concurrent-user counts tell you what is happening now. They do not tell you:
- how long an engaged user stays engaged,
- whether risk of leaving is concentrated early or spread evenly,
- whether a user who has already survived a year is a better or worse bet than a new one,
- or whether “the average user” is a real thing or an average over groups with nothing in common.
Those are lifecycle questions, and they need a lifecycle model. So the question becomes:
Using observed VRChat activity, can we characterise time-to-churn and describe how retention risk changes across a user’s lifecycle?
At first glance that is a regression problem. It isn’t, and the reason is hidden in the shape of the data rather than in the modelling.
2. What the data actually is
Everything here comes from the public Steam review corpus for VRChat (app 438100), collected on 2026-08-28. Per reviewer, Steam exposes:
| Field | What it is |
|---|---|
timestamp_created | when the review was written |
author_last_played | when Steam last saw that account play VRChat |
author_playtime_at_review | hours accumulated at the moment of the review |
author_playtime_forever | hours accumulated as of collection |
author_num_games_owned | games on the profile — or 0 when the profile is private |
voted_up, language, num_reviews | review metadata |
Two things are worth noticing immediately.
We do not see an activity history. We see two timestamps: the review, and the last session. There is no session log, so a user who quit for eight months and came back looks identical to one who played steadily throughout. Every design decision below is constrained by that.
One field is a trap. playtime_forever is measured at collection, so it contains behaviour that happened after the review. Its raw correlation with the outcome is 0.309 — it would have looked like a wonderfully predictive feature and would have been leakage. Only playtime_at_review, measured at the clock’s origin, is used anywhere in this project.
The rule I applied to every candidate feature: if I froze the world at the review timestamp, would I have known this value? If not, it cannot be a predictor of what happens after that timestamp.
3. What one observation is
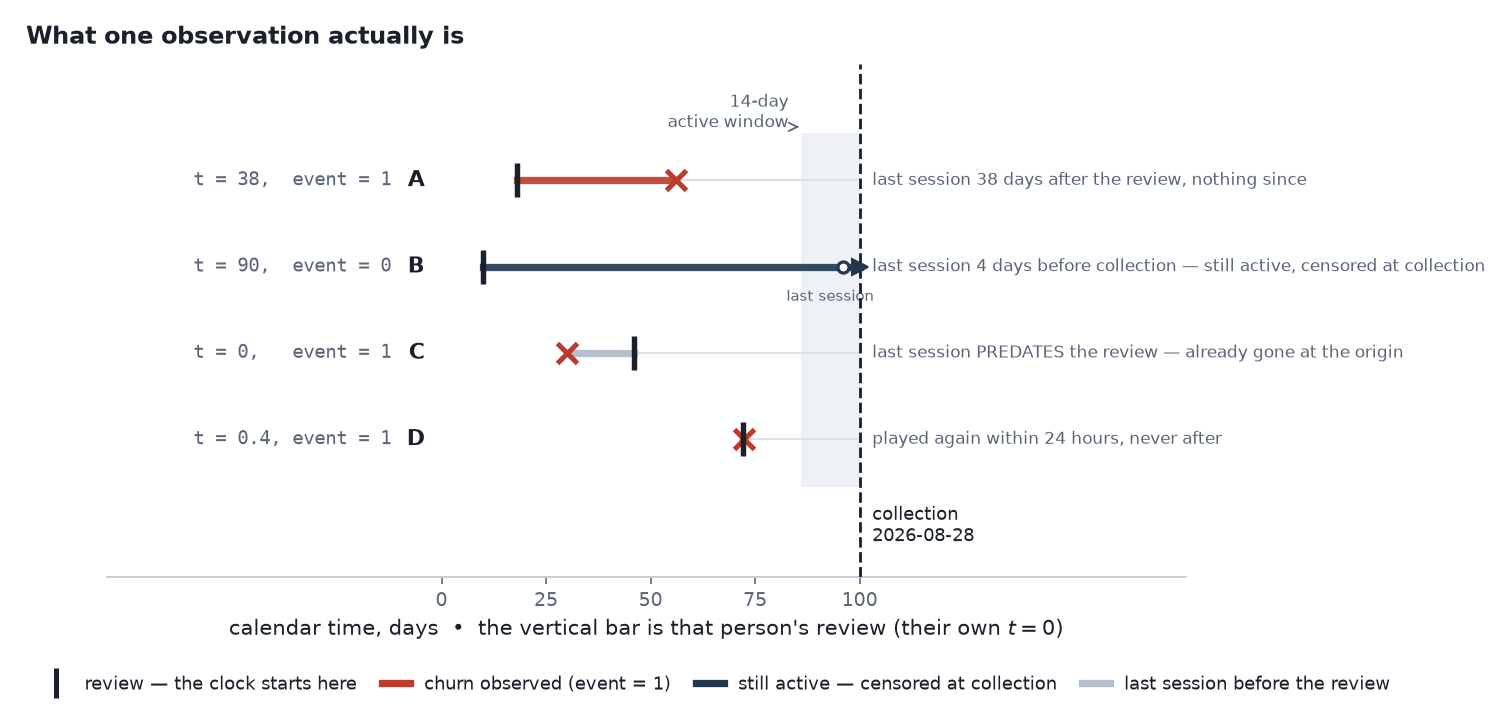
Each row is one reviewer. The vertical bar is their review — their own t = 0. Bars run to the last recorded session (red, churn observed) or to the collection date (navy, censored). Row C is a person whose last session predates the review they wrote.
The construction is:
- Origin: the review timestamp.
t = 0. - Duration: time from the review to the last recorded session.
- Event: observed if that last session was more than 14 days before collection.
- Censored: if they played within 14 days of collection, we only know they survived to the collection date.
Which gives 267,903 people, 202,795 observed churn events (75.7%) and 65,108 censored (24.3%).
4. The estimand — and the name I refuse to use
It is tempting to call this a user’s lifetime. That would be wrong, and a reviewer would catch it in the first minute.
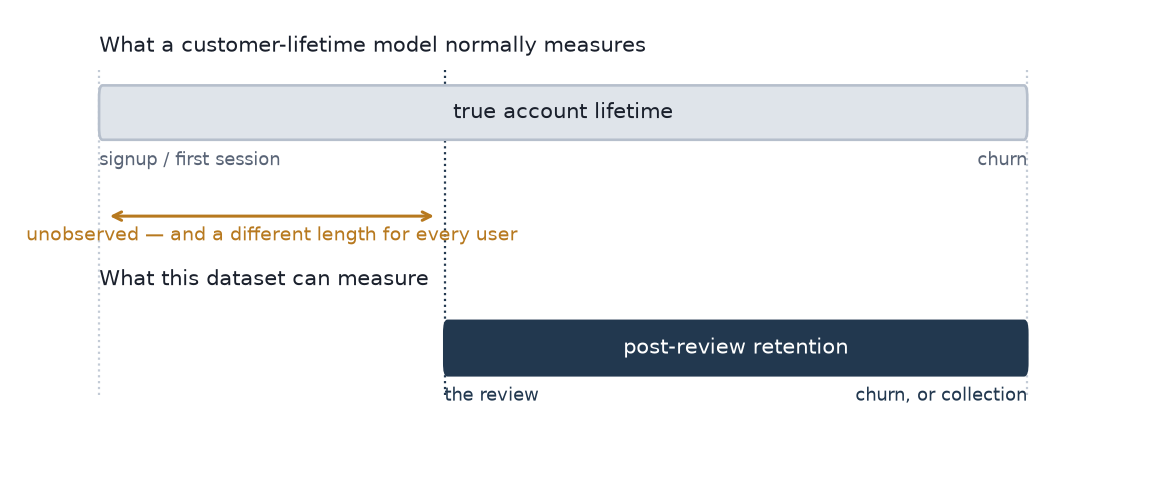 The clock does not start at signup. It starts at a self-selected event partway through the user’s life with the product.
The clock starts at a review, not at signup or first session — and a review is not a random point in someone’s lifecycle. People write one because something happened: they hit a milestone, or a patch annoyed them, or a friend group dissolved. So anchoring everyone at their review conditions the whole sample on having reached and generated that event, and the clock starts at a moment that is itself correlated with satisfaction, tenure and recent activity.
That is a second selection effect stacked on the first, and it is why “lifetime” is the wrong word. The estimand is:
Post-review time to 14-day inactivity, right-censored at the collection date, for the population of people who wrote a Steam review.
Not account lifetime. Every number in this series should be read with that scope attached. I put this in the second section rather than a limitations footnote because it defines what is being measured, not what is being apologised for.
5. Churn is a convention, so it gets tested like one
Permanent churn is not observable. Someone silent for 20 days may return next month. So “churn” here is an operational rule: no recorded session for 14 days before collection.
The 14-day threshold is inherited from the data pipeline, which makes it a judgement call, which makes it something to test rather than defend. Part 5 re-runs the headline numbers at 7, 21 and 30 days. The levels move — a 7-day rule labels more people churned and shortens every estimate, as it must. The ordering of segments does not move at all, and the gap between the weakest and strongest stays between 3.80× and 3.96× across the entire range.
6. Censoring is not random, and that is the whole point
If you ignore censoring and average the observed durations, you get a number that means nothing, because “still going” observations are treated as if they had ended.
Worse, the censoring here is administrative: a person is censored because the study stopped, and the study stopped at the same moment for everyone. So how long you were observable depends entirely on when you wrote your review.
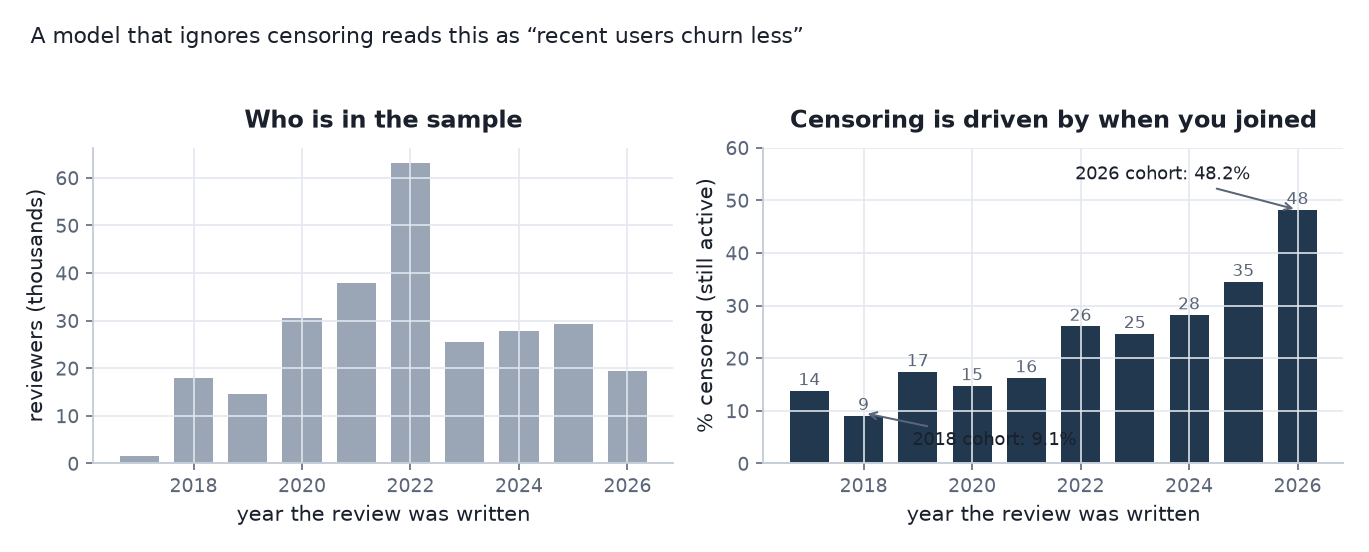 Left: how many reviewers came from each year. Right: the share still active at collection. A model that ignores this reads “recent users churn less” when the truth is “recent users have had less time to leave.”
9.1% of the 2018 cohort is censored. 48.2% of the 2026 cohort is. Any method that treats duration as a complete observation will conclude that VRChat’s newer users are dramatically stickier. They are not; they are younger.
This same fact returns in Part 2 as a much subtler problem, where it quietly threatens one of the most interesting-looking findings in the dataset.
7. The 8.5% that broke the first three models
Here is the structural feature that shaped the whole project.
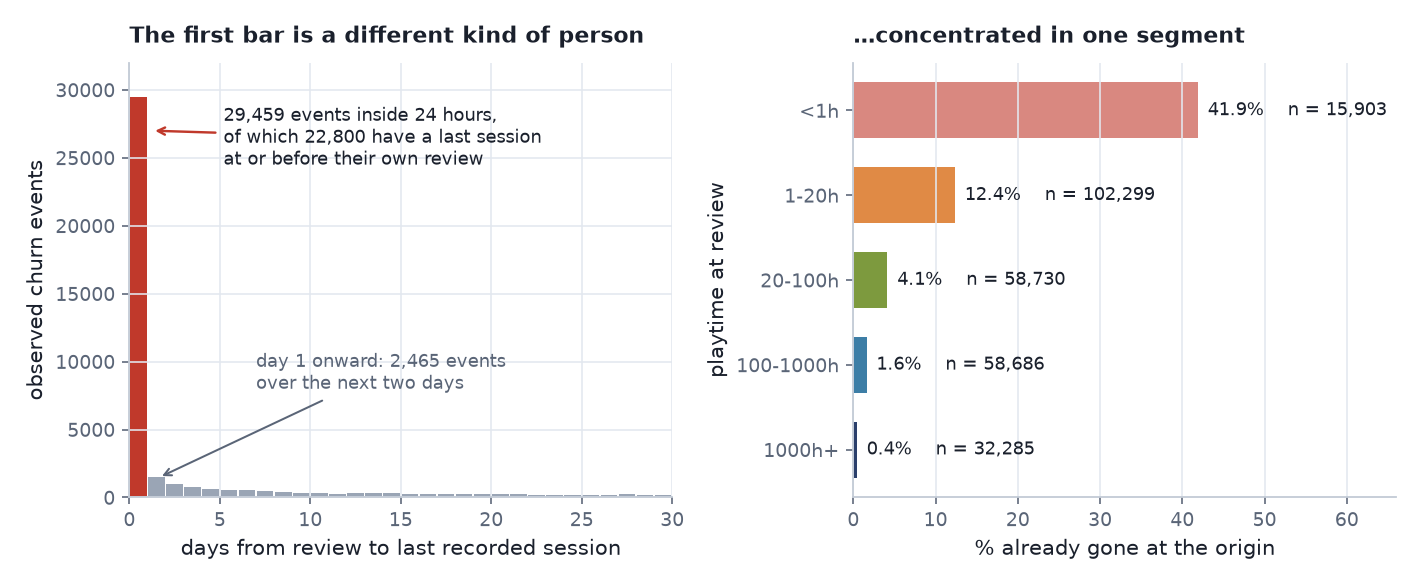 Left: observed churn events by day. The first bar holds 29,459 events inside 24 hours, of which 22,800 have a last session at or before the review itself. Right: the rate of already-gone within each segment — 41.9% against 0.4%. By headcount the atom sits mostly in the 1–20h band (55% of it), because that band is far larger.
22,800 people — 8.5% of the sample — have a last recorded session at or before the moment they wrote their review, to within the pipeline’s rounding. They had stopped playing by the time the clock starts.
That group is not homogeneous, and the pipeline throws away the detail that would show it: durations are clipped at zero, so the size of the pre-review gap is discarded. At day resolution, 17,552 of them last played on a strictly earlier date and 5,245 last played on the review date itself. Someone who last played eight months before writing and someone who stopped the same morning are both recorded as t = 0, and they are plainly not the same person. Recovering that gap would be the first thing I would change about the pipeline. They are not fast churners. They are people who came back to write a review after they had already left, which is a different behaviour with a different meaning.
Three consequences followed.
It cannot be modelled as a small duration. Continuous survival distributions cannot put probability mass on a single point, and the Weibull log-hazard diverges at t = 0 for shape below 1. Adding an epsilon would have been a fudge that hid a real structure. So the population is modelled as a two-part (hurdle) process:
Models 1–3 fit the second part only, on the 245,102 people with t > 0, and say so. Model 4 puts the halves back together. Part 3 shows the decomposition reproducing the full observed curve with a mean absolute error of 0.03 percentage points across horizons from 7 days to 7 years, worst case 0.08 pp — which is the empirical licence for splitting it this way.
It is not evenly distributed. 41.9% of the under-1-hour segment had already gone, against 0.4% of the 1000h+ segment. Any statistic that mixes these two populations flatters the weak segment. Part 5 shows this changing a headline number by 72%.
Dropping them is a real bug with a measurable size. An earlier version of the pipeline excluded these rows as corrupt. Excluding them moves the Kaplan–Meier median from 962 days to 1,106 days — a 15% overstatement, produced entirely by deleting the shortest-lived people in the sample.
Two rows, for completeness. One of the 22,801 zero-duration records is censored rather than an event (a person who reviewed on the collection day and was still active), which is why the count above is 22,800. And one review is dropped upstream for a Unix-epoch null timestamp, which is why 267,904 becomes 267,903. Neither moves any result — but a claim about data provenance is only worth something if it covers the rows you would rather not mention.
8. Two processes are running, and only one of them is about users
Everything measured in this series is a mixture of two things: when a person stops playing, and when we stop being able to see them. The second has nothing to do with the user — it is set by when they happened to write a review and when the collection ran.
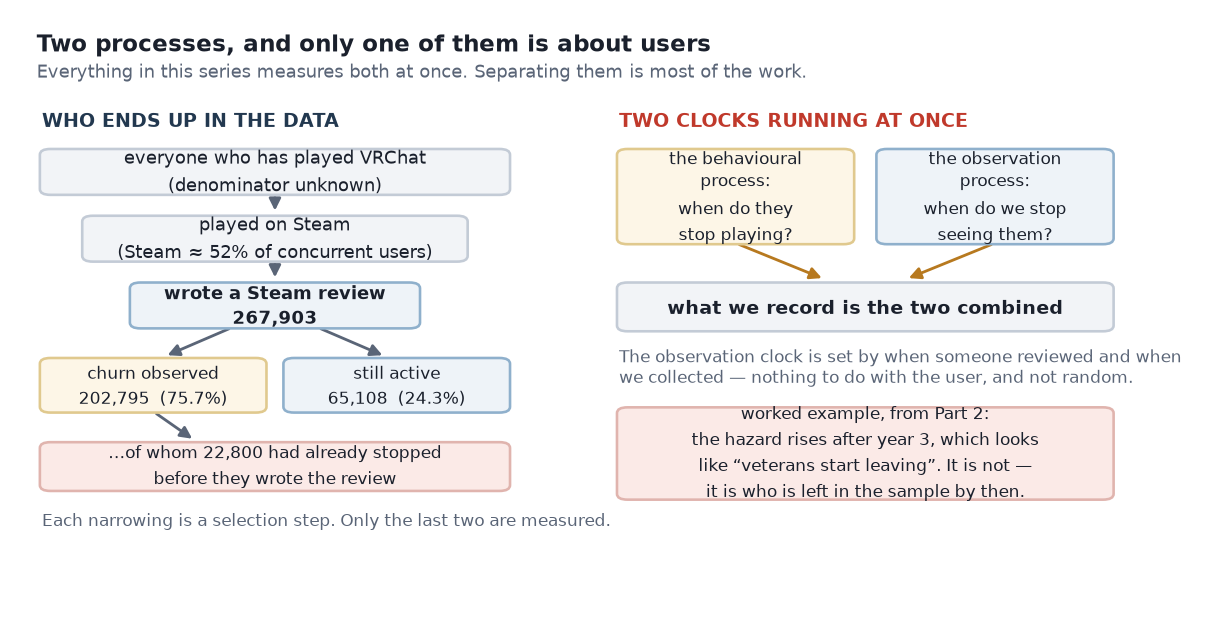 Left: every narrowing between “played VRChat” and “row in this dataset” is a selection step, and only the last two are measured. Right: the behavioural clock and the observation clock, and the fact that what gets recorded is the two combined.
Keeping them apart is most of the analytical work in Part 2, and it has a concrete payoff there. The hazard rises after year three, which reads naturally as “long-tenured users start leaving”. It is not that. To still be at risk at year three you must have reviewed at least three years before collection, so the late data is increasingly a sample of old joiners rather than a measurement of what happens to users as they age.
The general form of the question to ask of any surprising retention pattern: could the way the data was collected have produced this? If the answer is yes and you cannot rule it out, the pattern is not a finding.
9. Two more decisions made before looking at any outcome
Segments. Playtime bands are cut at order-of-magnitude boundaries — under 1h, 1–20h, 20–100h, 100–1000h, 1000h+ — chosen before looking at any outcome, so they cannot be reverse-engineered into a flattering story. They are a modelling convenience for asking whether the retention process differs by engagement level, not a claim that five natural kinds of user exist.
Missing data — and the difference between a value being present and a value being usable. games_owned == 0 is Steam’s private-profile flag, not a count. It is populated, it is numeric, it will happily go into a model, and it means “we cannot see this”. 46% of profiles are private, and 83% of those users have written more than one review, which is impossible if they own nothing. Treating zero as data would have invented a 123,000-person segment of people who own no games and then found that owning no games predicts churn.
The field is median-imputed with an explicit profile_public flag alongside it — and Part 5 shows what that imputation costs, because it does cost something.
10. What this analysis will not claim
Stating this up front is cheaper than defending it later.
| Not claimed | Why |
|---|---|
| True account lifetime | The clock starts at a review, not at signup |
| Permanent churn | Inactivity is an operational rule, tested but still a convention |
| Platform-wide retention | The sample is Steam reviewers, not all VRChat users |
| Causal effects of engagement | Playtime is not randomly assigned |
| Monetary LTV | Survival time is not revenue; the data has no revenue |
One thing I cannot do is put a number on the selection. Steam does not publish how many accounts have played VRChat, so there is no denominator for “267,903 reviewers out of how many players?” — and review rates on Steam typically run in the low single-digit percent, which would make this a study of a small and unusual slice. The direction is also ambiguous: reviewers are plausibly both more engaged and more disgruntled than the base population, so it does not cleanly bias one way. What I can say is that every number here describes reviewers, and that the gap between reviewers and players is unmeasured rather than small.
There is one more caveat with teeth: churn here is Steam-only. A user who moves to a standalone Quest headset looks churned and is not. Steam sees roughly half of VRChat’s concurrent users, so this is a real source of false churn and it biases every estimate here toward pessimism.
11. The question, restated so it can be answered
Among users represented in the Steam review corpus, how does post-review retention evolve over time, when is the risk of operational churn highest, and how does that trajectory differ across engagement segments?
That is narrower than where we started. It is also answerable, which the first version was not.
And it sets the order of the rest of the series. Each part asks one question, and the answer decides whether the next part is needed at all:
| Question | Answered in | |
|---|---|---|
| 1 | What shape is the retention process, before any model is imposed? | Part 2 |
| 2 | Can a constant hazard describe it? Can any single smooth shape? | Part 3 |
| 3 | If not, can the hazard be estimated freely over time instead? | Part 3 |
| 4 | Do different kinds of user follow different trajectories? | Part 4 |
| 5 | Does the extra structure earn its place out of sample — and what should anyone do about any of it? | Part 5 |
No model in that sequence was chosen because it sounded sophisticated. Each one exists because the previous answer ruled something out.
12. What this part is worth to the business
Estimand work reads like overhead. It is the opposite: three of the four decisions above have a price tag attached, and a team that skipped them would have shipped numbers that were confidently wrong.
| Decision | What skipping it costs |
|---|---|
| Separating the 8.5% already-gone | The weakest segment’s value is overstated by 72%, and the spread between weakest and strongest compresses from 3.9× to 2.3× — so a value-based targeting strategy points at the wrong users. Part 5 shows this happening to me |
Excluding playtime_forever | It correlates 0.309 with the outcome. A model using it would look excellent offline and do nothing in production, because the feature encodes the future you are trying to predict |
| Handling censoring properly | Naive duration averaging says the 2026 cohort is dramatically stickier than the 2018 cohort. It is not; it has had 4.9 months of exposure against 100.9. That is the kind of error that gets a cohort strategy funded on nothing |
| Naming the estimand honestly | Calling this “user lifetime” invites someone to plug it into an LTV model built on signup-anchored assumptions. It is post-review retention, and the difference is not cosmetic |
One finding that fell out of the estimand work
The 22,800 people who wrote a review after they had already stopped playing are not just a modelling nuisance. They behave differently in a way that matters commercially.
| already stopped playing | still active | |
|---|---|---|
| People | 22,800 | 245,103 |
| Left a negative review | 43.5% | 23.1% |
| Median playtime at review | 2.9 h | 37.1 h |
An already-departed reviewer is 1.89× as likely to leave a negative review — and that widens to 2.36× once you compare within playtime bands, so it is not a playtime artefact. They are 8.5% of reviewers and write 14.9% of all negative reviews.
The consequence for anyone reading a review-sentiment dashboard: a meaningful share of reviews are exit interviews, not satisfaction surveys. A dip in review score can mean “more people left and said so on the way out”, which is a lagging signal about churn that already happened, not a leading signal about how the product feels today. Splitting sentiment by whether the reviewer was still active costs nothing and separates the two. Nothing in this series required that finding — it fell out of taking the day-zero atom seriously instead of dropping it.
And one thing this part quantifies about the data itself. Two of the biggest limitations — the clock cannot start at signup, and churn is Steam-only on a platform where Steam sees about half the users — are not analysis problems. They are instrumentation problems, and no amount of modelling fixes either.
Concretely, the table this analysis would want does not look exotic:
1
2
3
4
5
6
7
8
user_id
first_meaningful_activity      ← the clock should start here, not at a review
session history                ← so a gap is visible as a gap, not as an ending
engagement features, as at the prediction time
acquisition cohort
platform / device
experiment exposure
revenue
Three of those seven lines would remove a named limitation from this series outright. first_meaningful_activity turns post-review retention into account lifetime. A session history makes “churn” a measurement rather than a 14-day convention, and makes a user who left and came back distinguishable from one who never left. platform closes the Steam-only blind spot that Part 5 has to handle with a scenario sweep instead. The single highest-leverage investment here is not a better model; it is a first-party event stream with a signup-anchored clock.
Next: Part 2 — what the data said before I fitted anything. Before choosing a model, I let the data tell me what shape the retention process has. The answer ruled out most of the standard survival toolkit in one figure — and produced a second finding that looked like a discovery until I checked who was left in the sample.
Everything in this series is fit in NumPyro (Python 3.12 / JAX) in float64, with convergence gates on every model, PSIS-LOO for model comparison, and credible intervals on every published quantity. Data: public Steam review corpus for app 438100, collected 2026-08-28.