VRChat Part 2: When do VRChat reviewers leave, and who leaves sooner?
A case study on public Steam reviews: the shape of the risk of leaving, a 2025 shift, what playtime, thumbs and language add, and a model checked on held out reviewers and later years.
VRChat retention case study | Part 1: Who stays | Part 2: Who leaves sooner | Part 3: A fair test
When do VRChat reviewers leave? The risk is about 70 times higher on the first day after a review than later on, then stays low and flat for years, though it rose in 2024 for people three or more years past their review, and in 2025 at every stage from day 30 on. Hours played at the review are the strongest signal of who leaves, especially early: on the first day, a player with under an hour is about 130 times as likely to stop as one with over 1,000 hours, and after two years about 5 times as likely.
Part 1 used curves. Here I model the daily risk of leaving, check how it shifted over the years, and test the model on reviewers it hasn’t seen.
229,920 reviewers | piecewise exponential and Cox models | lifelines | notebook
1. The risk is far from constant
- Most dashboards use a single churn rate. Here it would be 0.56 stops per 1,000 players per day.
- It gets the shape wrong. It says 86.9% are still playing at day 90; the real number is 82.1%.
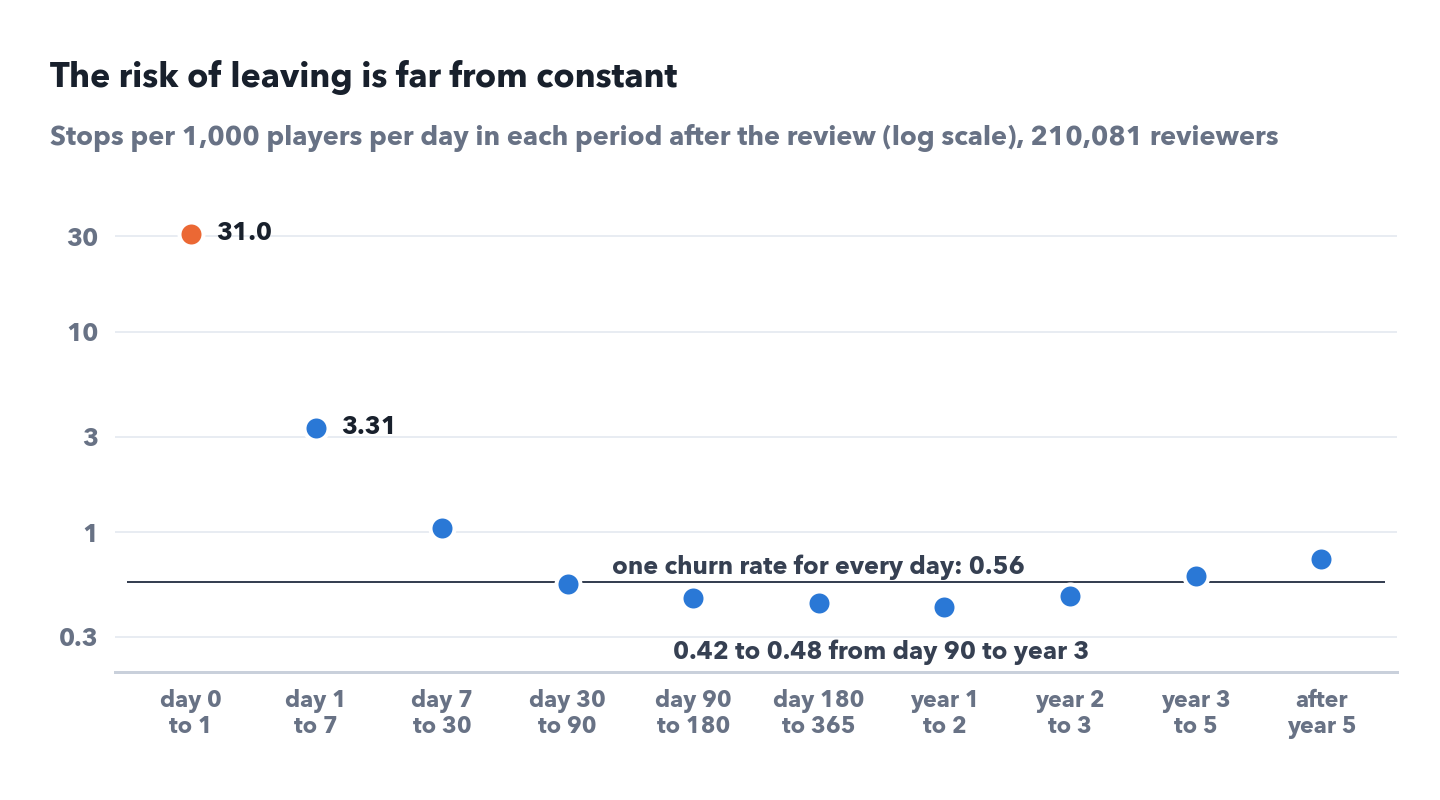
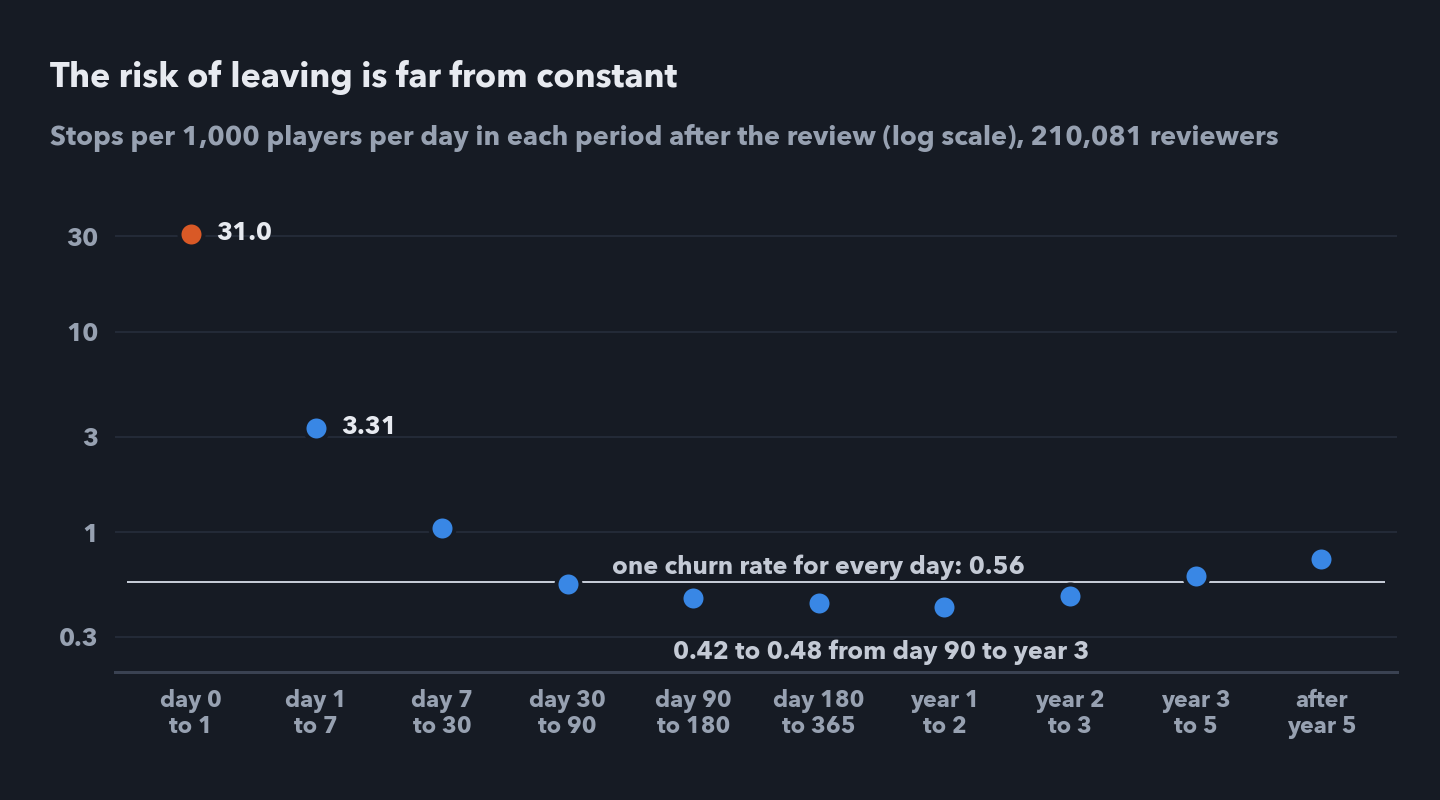 Risk of leaving in each period after the review, on a log scale. First day: 31.0. From day 90 to year 3: between 0.42 and 0.48, below the single churn rate of 0.56.
- The first day is special. Half of its stops, 3,249 of 6,341, had their last session within an hour after the review. Many people seem to write the review during what turns out to be their final session.
- Standard survival curves don’t fit either. Weibull, log normal and log logistic can’t follow “very high for a few days, then flat for years”. The best of them, Weibull, puts one year retention at 67.2% against the real 72.5%.
- What does fit is a separate risk for each of ten time periods. It misses the real curve by only 0.16 points on average.
- The first day’s risk is about 70 times the normal level, but more people leave later in total: about 10,300 in the first week, against about 20,000 between day 90 and year 1.
Half of the first day’s stops happen within an hour of the review. Help that waits for the next login can’t reach them.
2. Something changed in 2024 and 2025
- The risk rises a little after year 3. But only people who reviewed long ago reach year 3, and they reach it in recent years. So “time since the review” and “calendar year” are mixed up.
- To separate them, I measured the risk at each stage in each calendar year.
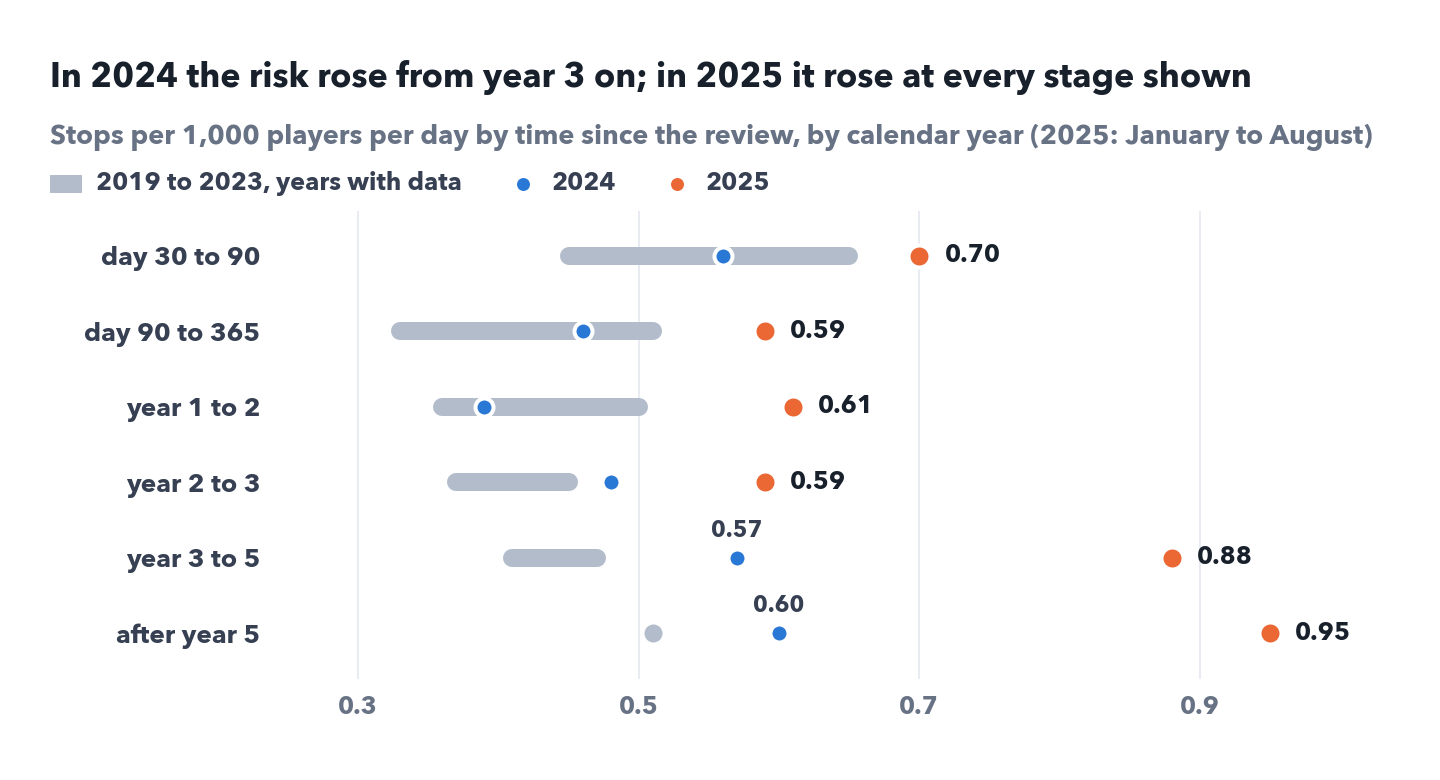
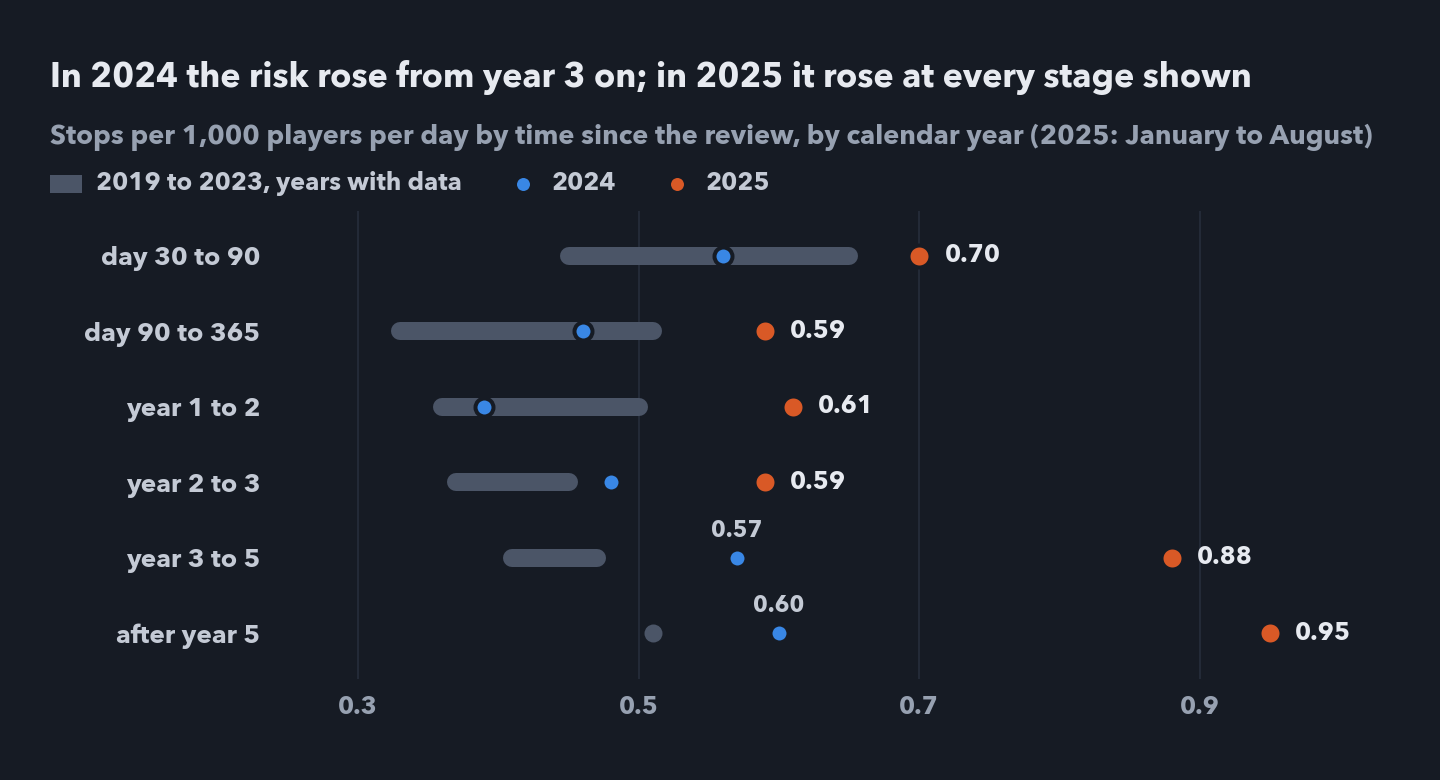 Risk per 1,000 players per day at each stage after the review. Grey bars: range across 2019 to 2023. Blue: 2024. Orange: 2025, January to August.
- Up to 2023 the risk was about the same at every stage: 0.33 to 0.51 in 2023.
- In 2024 the stages from year 3 on went up, to 0.57 and 0.60.
- In 2025 every stage from day 30 on went up, most of all from year 3 on: 0.88 and 0.95.
- Recent stops have had less time to be confirmed, so I checked again with a stricter rule: at least 18 months without play. Comparing early 2025 with the same weeks of 2024, from year 3 on, 2025 is still well above: 0.81 and 0.96, against 0.53 and 0.57.
While this lasts, a model trained on older years will be too optimistic about recent players.
What could explain it
The data can’t say what changed, but it can narrow the options.
- Not the mobile launch. VRChat’s Android open beta started in August 2025, and the full Android and iOS release came on 24 October 2025 (Road to VR). The rise is already there from January to early March 2025, before either. Until then, mobile was limited to subscribers and invited testers.
- Players moving off Steam. Someone who switches from a PC headset to a standalone one keeps playing VRChat but disappears from Steam, and this data counts that as leaving. Standalone headsets have run VRChat since December 2018, and Meta’s $299 Quest 3S came out on 15 October 2024, just before the 2025 rise.
- Players really playing less. If so, it would show up in VRChat’s own data too, not only on Steam.
How I’d tell them apart:
- With public data: compare VRChat’s own concurrent user records with Steam’s player counts for 2023 to 2025. If Steam’s share fell, players were moving platforms.
- With VRChat’s data: for players who stopped on Steam, check whether their account stayed active on another platform. That settles it.
3. Playtime, thumbs and language together
To look at all three at once I used a Cox model. It gives each input a multiplier on the daily risk of leaving.
The first fit: over 1,000 hours has a multiplier of 0.089 compared with under 1 hour, about one eleventh of the risk. A thumbs down is 1.14, and another language 1.15.
Two checks changed the picture.
Protest thumbs downs are different. Setting the July 2022 protest week apart raises the normal thumbs down multiplier to 1.24. A protest thumbs down came to about 0.91: no extra risk.
The playtime effect fades over time.
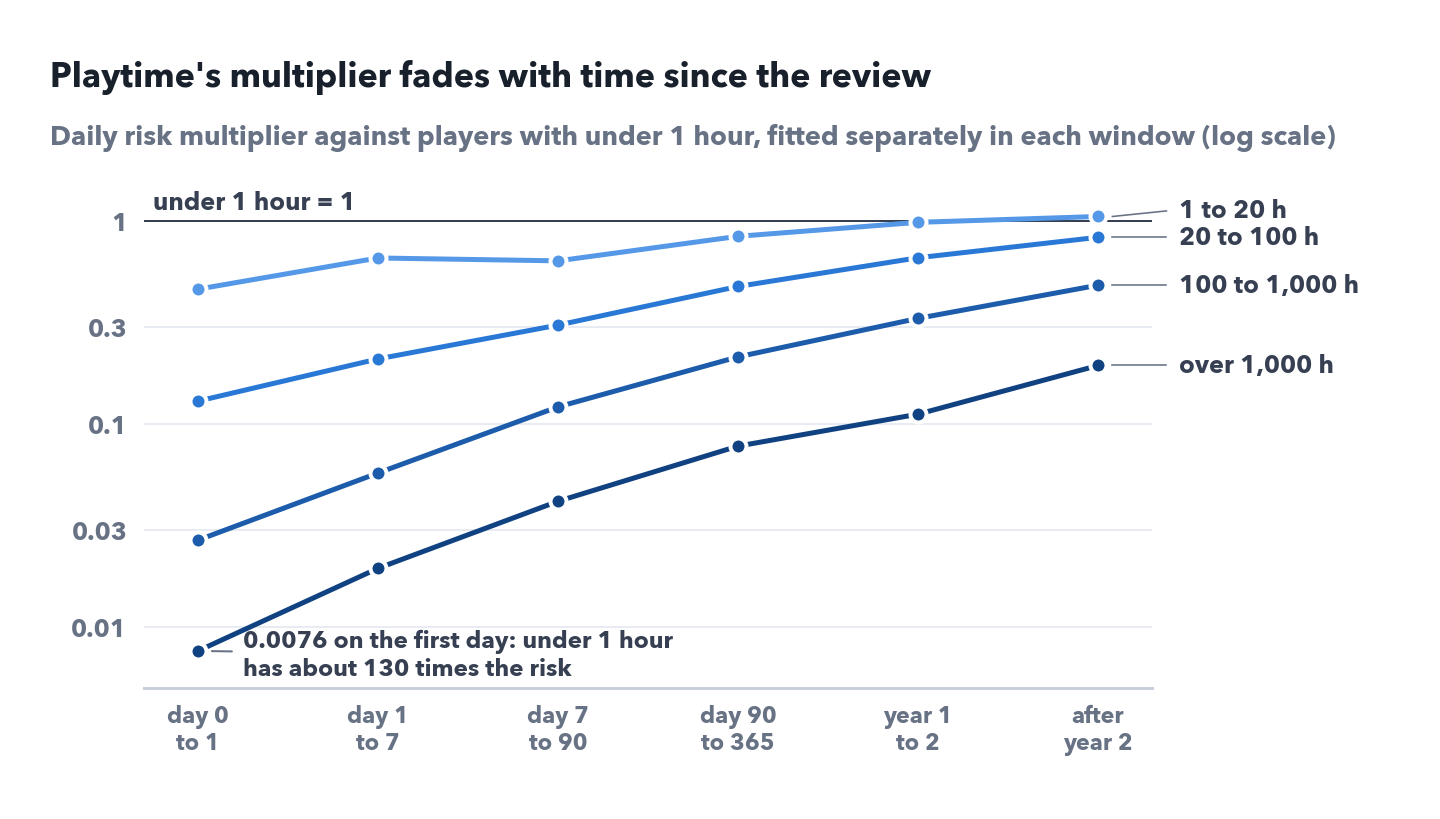
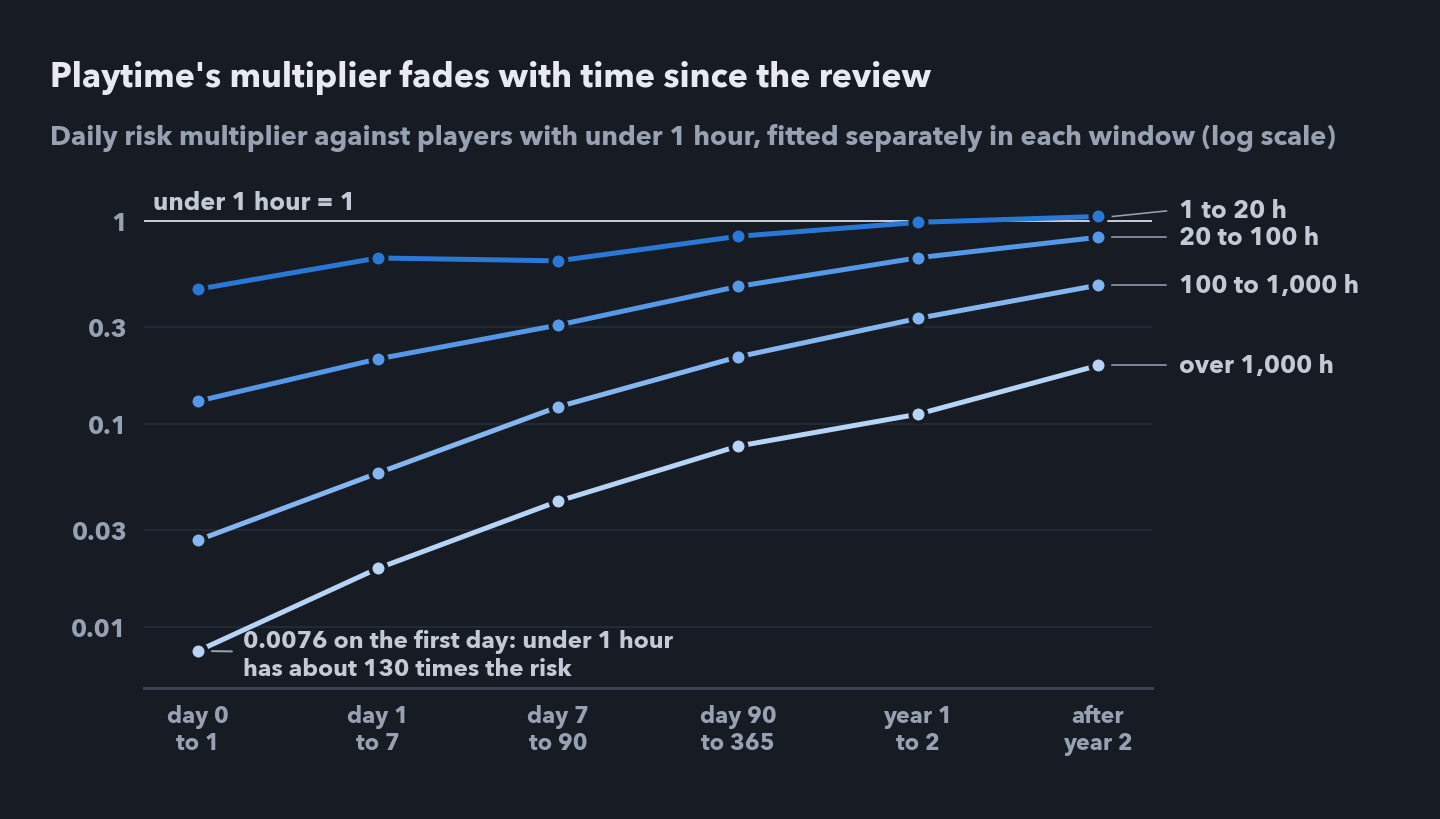 Risk multiplier for each playtime group against under 1 hour, fitted separately in six time windows. The over 1,000 hour group goes from 0.0076 on the first day to 0.19 after year two.
- On the first day the gap between the lightest and heaviest players is about 130 times. After year two it’s about 5 times. So one fixed multiplier, about 0.09, is wrong at every point in time.
- Two possible reasons: playtime at review is a snapshot that gets older, and the light players who will leave go first, so the ones who remain are keener.
- My fix: one small model per playtime group, so each group gets its own risk over time and its own multipliers.
What the per group models show:
- A thumbs down matters more for heavy players, but only in relative terms. The multiplier is 1.08 under 1 hour, 1.21 for new players and 1.47 over 1,000 hours. Heavy players rarely leave, though, so in real numbers that’s about 5 more in 100 new players gone within a year, and about 1 more in 100 heavy players.
- Language matters only for light players: 1.23 under 1 hour, 1.19 at 1 to 20 hours, 1.09 at 20 to 100 hours, and nothing from 100 hours up.
- From 1 hour of play up, thumbs down reviewers are 3 to 5 times as likely to have already stopped.
4. Testing the model
Test 1: held out reviewers from the same years. I fitted the model on a random half of the reviewers and predicted the other half: the share still playing a year later, for ten groups (five playtime groups, each with thumbs up or down).
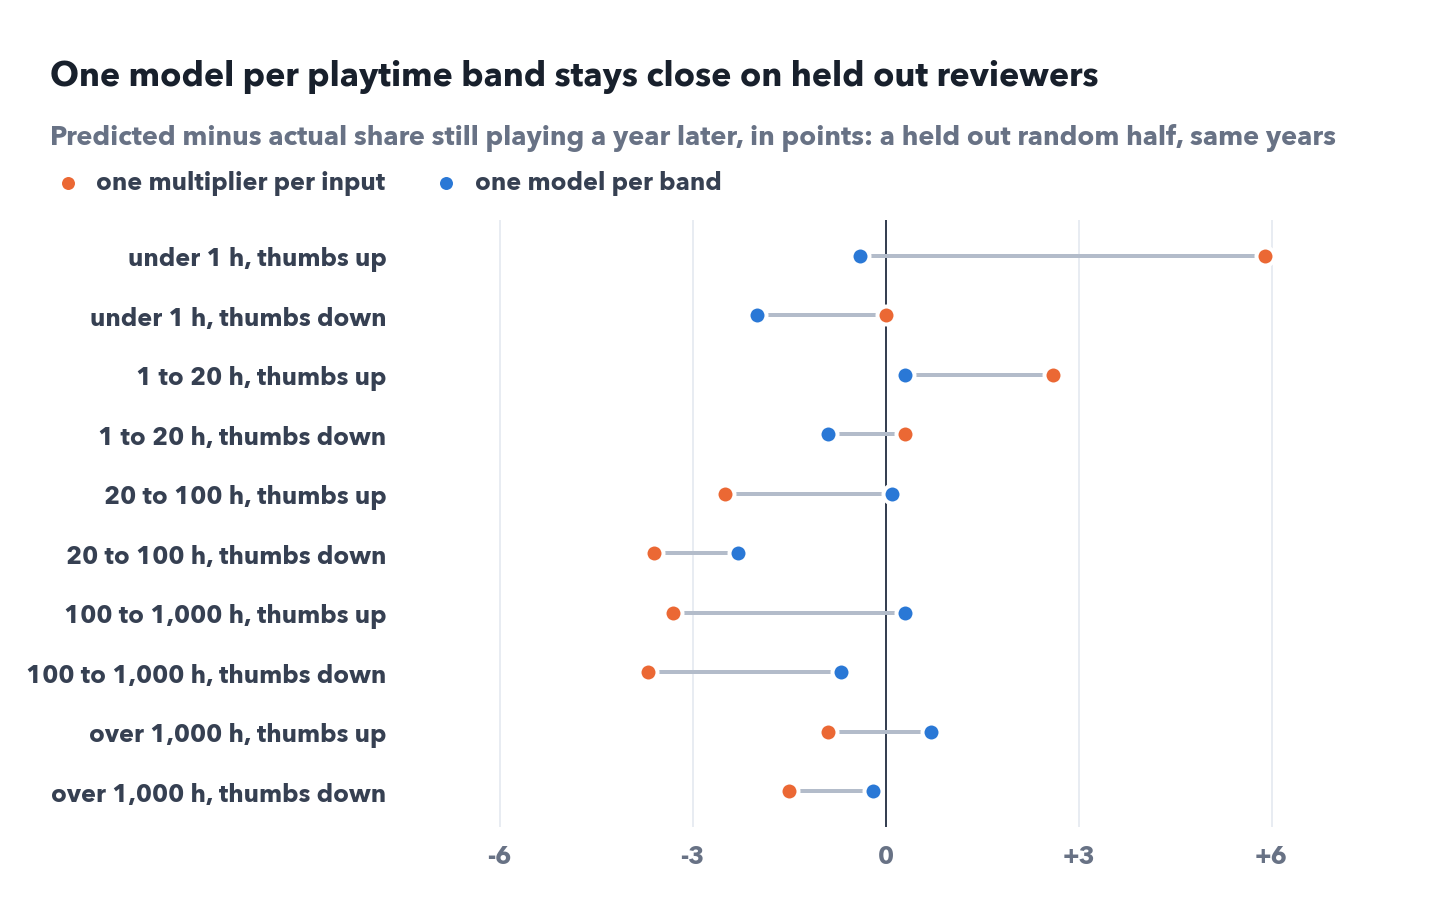
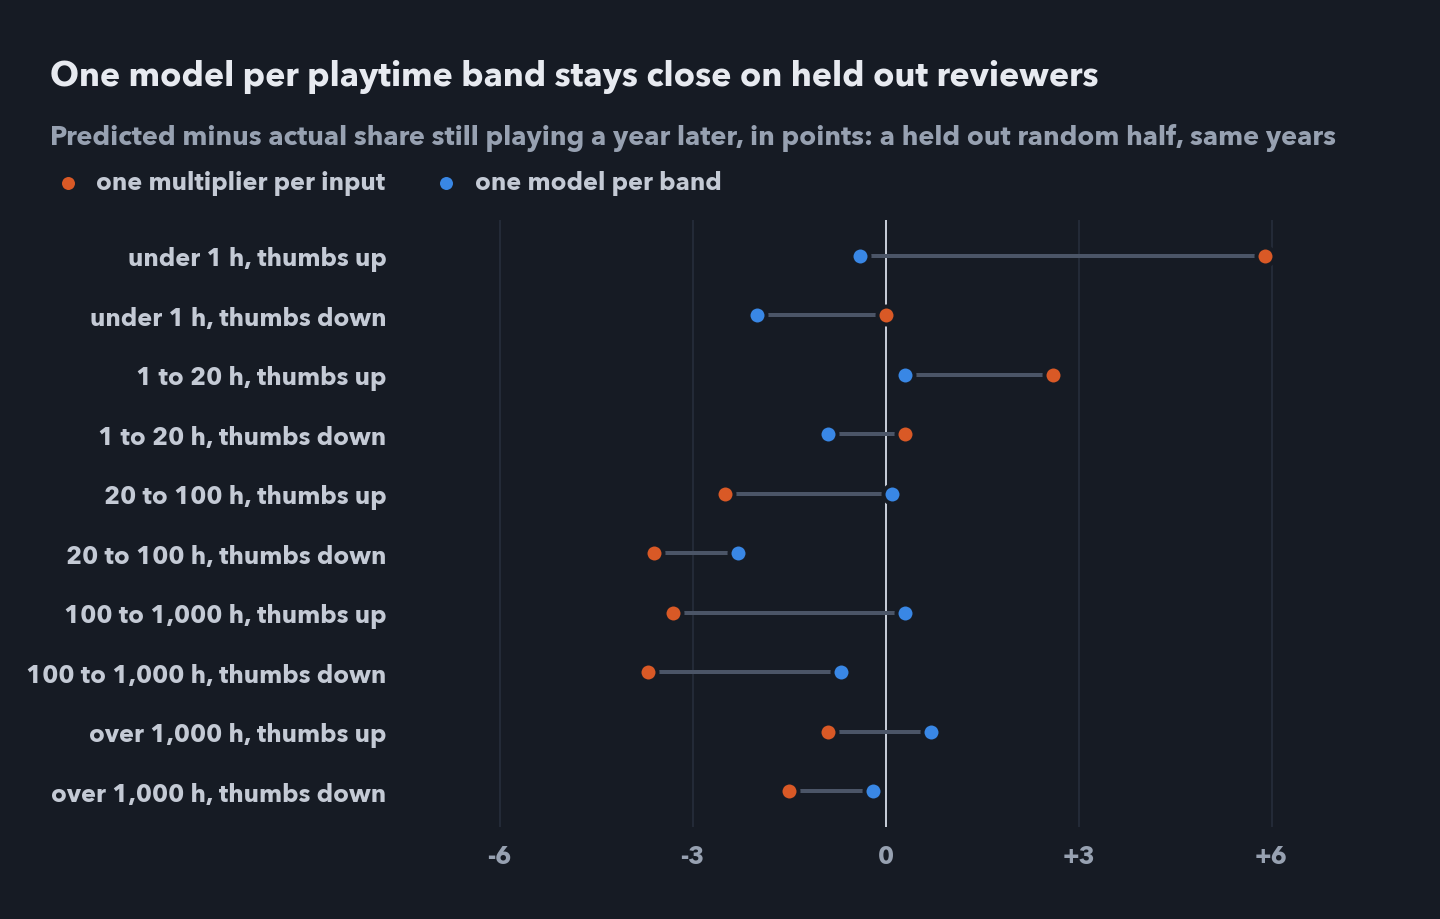 Predicted minus actual share still playing a year later, in points. One multiplier per input misses by up to 5.9 points, 2.5 on average. One model per playtime group misses by at most 2.3, 0.8 on average, about the size of the random noise in these groups.
- For everyone together, the per group model predicts 72.7% against the real 72.5%.
Test 2: later years. I fitted the model on reviewers from 2019 to 2022 and predicted those from 2023 and 2024.
- It predicted 77.4% still playing a year later. The real number was 73.1%.
- It missed the ten groups by 4.1 points on average, about the same as the simpler model’s 4.2.
- Why: newer reviewers came in with more hours, so the model expected them to stay longer. But inside every playtime group they did worse. For 1 to 20 hours, the share still playing a year later went from 61.9% to 58.1% for 2023 and 53.1% for 2024.
The overall number barely moved, 74.5% to 73.1%, while every group got worse. Track retention inside playtime groups, not just overall.
5. What this means for a typical new player
Retained days below are the calendar days from the review to the last session, counted over the next 365 days.
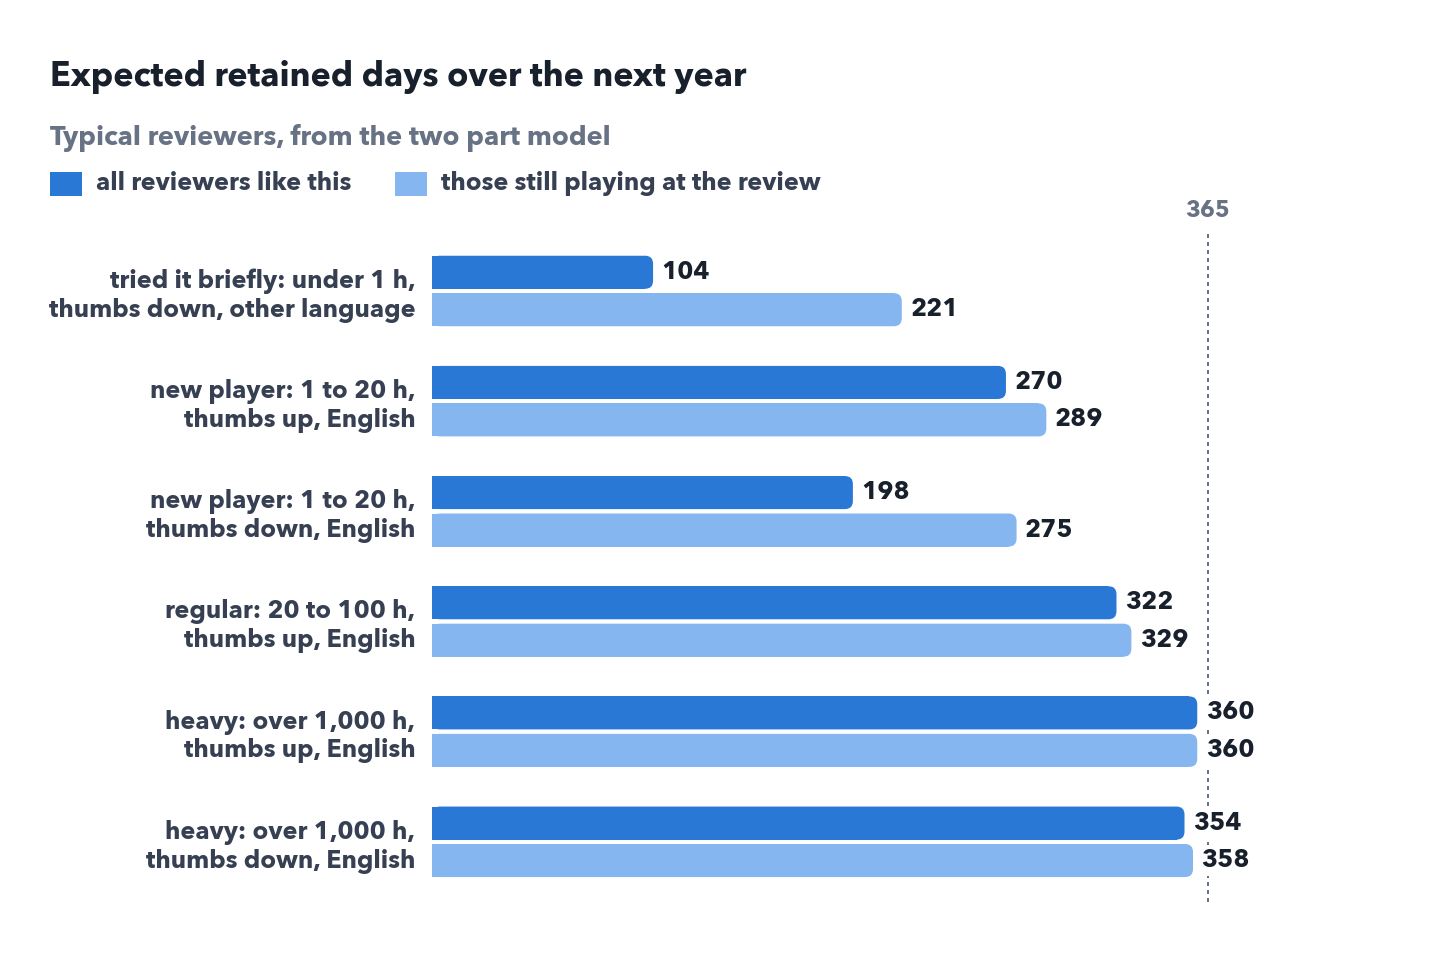
 Expected retained days over the next 365, for typical reviewers. The light bars leave out people who had already stopped before writing or editing.
- A typical new player with a thumbs down has about 70 fewer retained days than one with a thumbs up: 198 against 270.
- Among those still playing at the review, the gap is only 14 days: 275 against 289.
- So about 60 of the 70 days come from people who had already stopped. Help can only reach the small part that’s left.
- The range is tight: refitting the model on 200 bootstrap resamples gives 72 days (95% interval 69 to 75), about 59 (57 to 61) from people who had already stopped and about 14 (11 to 16) from people still playing. It’s still an association, not a cause.
- Heavy players stay near the maximum either way, at 360 and 354 days.
6. What I can and can’t say
I can say
- The risk of leaving is highest right after the review and settles after about three months.
- From year 3 after the review, the risk rose in 2024. In 2025 it was higher at every stage from day 30 on.
- Playtime at review has by far the biggest link to leaving, and the link is much stronger in the first days than years later.
- One model per playtime group matches held out reviewers from the same years to within about a point.
I can’t say
- Why the risk rose in 2025.
- That any input causes leaving. A thumbs down and leaving can share a cause.
- The exact thumbs down multiplier: comparing people within the same start year makes it 0.07 to 0.10 smaller.
- That the model forecasts future reviewers well. On later years it missed by about 4 points.
- What happens to any one person. The model is for groups.
Next: Players under 20 hours make up two thirds of all stops, and their risk peaks right after the review. A negative review is one of the few moments VRChat can talk to them directly, so help at that moment is a natural thing to test. Part 3 designs and sizes that test.
Data: Steam’s public review feed for VRChat (app 438100), downloaded on 28 Aug 2026. Analysis in Python with pandas, lifelines and SciPy. The notebook for this part reproduces every result on this page.